
Geographical distribution of foreign trade
80.0% of Tunisian exports are destined for the EU and UMA during the year 2020, despite the drop in our exports to these two destinations (EU: -11.3%, UMA: -22.3%).
Our national exports also fell to the Agadir zone (-14.5%, share: 2%), sub-Saharan Africa (-3.5%, share: 2.7%) and Asia (-13.2%, share: 4.0%).
On the other hand, our exports recorded an increase to Turkey (+13.1%, share: 1.2%).
Outside the EU, the trade deficit worsens, reaching in terms of value 15819.3 MD (instead of 12757.8 MD), this result shows the importance of our foreign trade with our main partner the EU (ranking first: customer and supplier) and its effect on the national trade balance.
The trade balance deficit recorded in 2020 of around -12757.8 MD is largely explained by the deficit recorded with certain countries:
China: -5393.8 MD
Turkey: -2140.6 MD
Algeria: -1719.5 MD
Ukraine: -1431.9 MD
Russia: -1007.0 MD
India: -608.3 MD
On the other hand, a trade balance surplus is recorded with other countries:
France: 3515.8 MD
Germany: 1217.0 MD
Libya: 1096.3 MD
Morocco: 294.6 MD
SECTORAL ANALYSIS OF EXPORTS
The analysis of exports by sector of activity during the year 2020 shows the following observations:
Selon la structure des exportations le secteur des IME est classé le premier avec une part d’environ 45.4% et une baisse des exportations de -14.0%.
The decline in exports concerns several sectors of activity. The rates vary between -24.4% (Mining, phosphates and derivatives sector) and -9.4% (Energy sector).
On the other hand, the sector of Agriculture and agro-food industries recorded an increase of 12.0% following the increase in our sales of olive oil.
Excluding the Energy, Phosphate Mines and drift sectors, foreign trade during the year 2020 is characterized by:
Trade deficit : 9120.8 MD (instead of 12757.8MD)
Decrease in exports of around 11.4% (instead of -11.7%)
Fall in imports of around 15.0% (instead of -18.7%)
Coverage rate of 79.4% instead of 75.2%
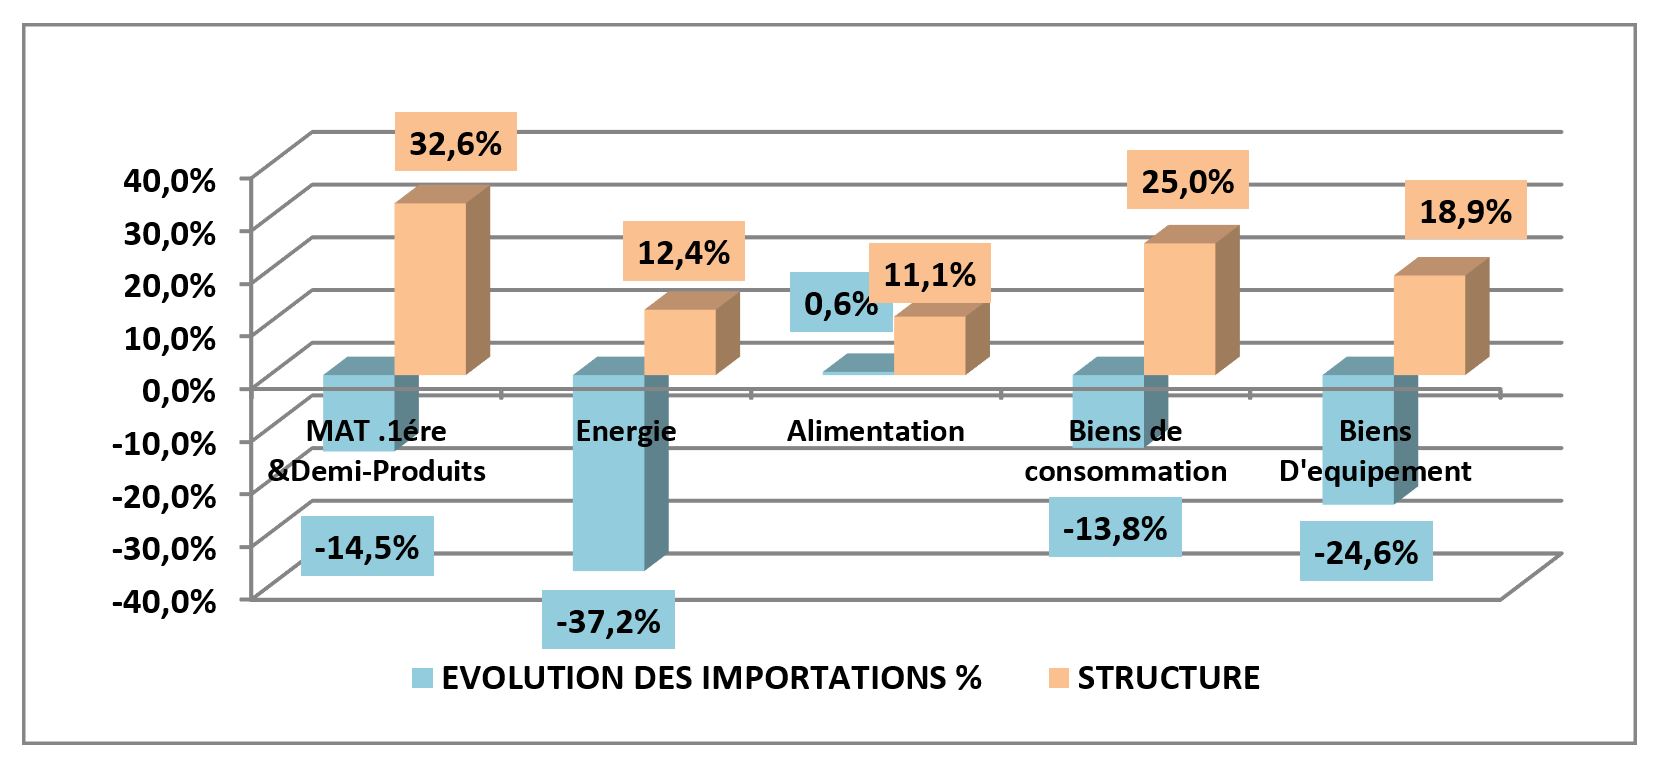
Analysis of imports by product groups:
The food product group recorded a slight increase of 0.6% (share: 11.1%) following the increase in our imports of durum wheat, barley, corn and soybean meal.
On the other hand, the rest of the product groups recorded a decline during the year 2020: Raw material & Semi-finished products (-14.5%, share: 32.6%), Consumer goods (13.8%, share: 25.0%), Goods Equipment (-24.6%, share: 18.9%), Energy (-37.2%, share: 12.4%).
TRADE BALANCE
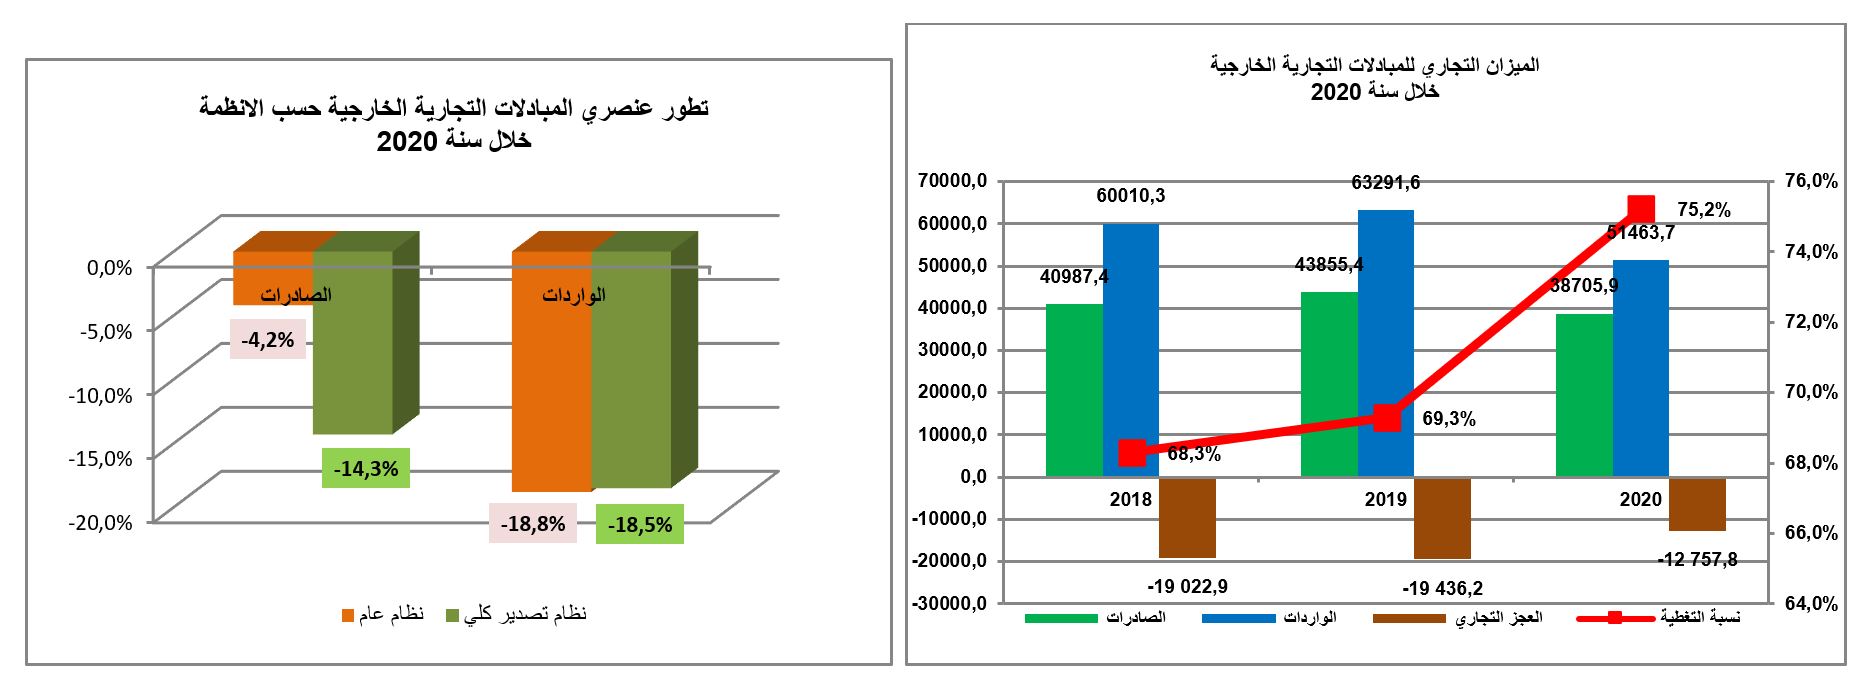
During the year 2020, exports recorded a decrease of 11.7% against an increase of 7.0% in 2019.in terms of value they reached 38705.9 MD against 43855.4 MD in 2019.
As for imports, they recorded a drop of 18.7% against an increase of 5.5% in 2019, in terms of value they reached 51463.7 MD against 63291.6 MD in 2019.
Thus, the trade deficit is reduced by 34.4% or 6678.4 MD. The coverage rate stands at 75.2% (against 69.3% in 2019) recording an improvement of 5.9 points.
Foreign Trade according to the Regime:
The Off shore regime::
Decrease in exports of around 14.3% against an increase of 9.4% in 2019
Imports fell by around 18.5% compared to an increase of 5.9% in 2019
The general regime:
Decrease in exports of around 4.2% against an increase of 0.4% in 2019
Decrease in imports of around 18.8% against an increase of 5.3% in 2019
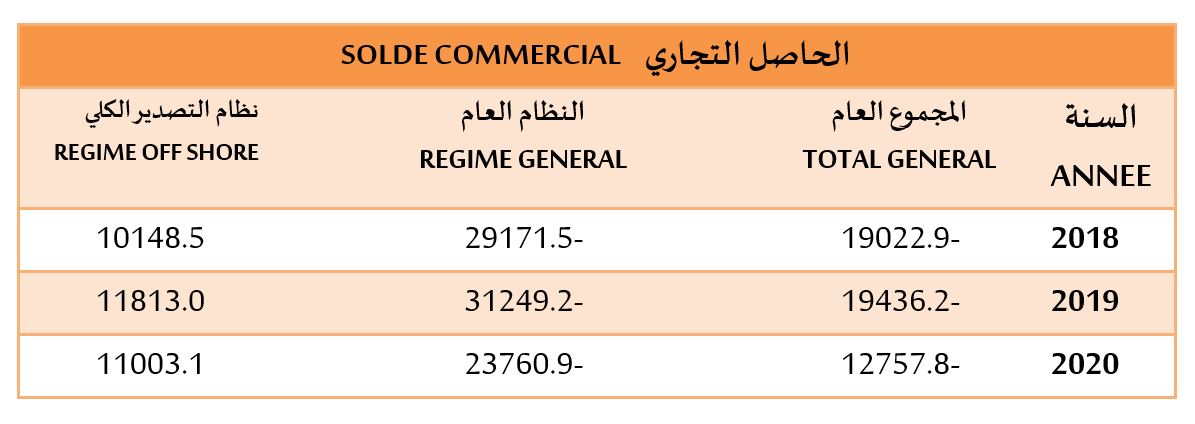
Trade Balance Analysis:
During the year 2020, the trade balance is in deficit by approximately 12757.8 MD (compared to -19436.2 MD in 2019).
According to the foreign trade regime, we note:
The general regime: trade deficit of about 23760.9 MD
The Off shore regime: trade surplus of about 11003.1 MD
